Introduction
From 2010 to 2011, the price of gas increased from \$3.02/gallon to \$3.75/gallon. According to the law of demand, the quantity demanded should decrease. In fact, it did decrease. From 2010 to 2011, the quantity of gasoline consumed per day fell from 9 million barrels/day to 8.8 million barrels/day. (2% decrease).
It’s interesting to note that the price increased by 24% whereas the quantity only decreased by 2%. Why is that? Regardless of gasoline prices, people will always need gas, so they will continue to buy.
Price Elasticity of Demand
Elasticity of demand is defined by the following ratio:
If this is greater than 1, then the good is elastic. This means a small change in price will lead to a greater change in quantity demanded. The opposite is inelastic.
Factors
Number of Substitutes
A good with few substitutes (gasoline), will be inelastic. If the price increases, people do not have another option to switch to. A good with many substitutes (cereal) is elastic. If Honey Nut Cheerios becomes even a little bit more expensive, there are 30 other options in the same grocery store aisle that you could buy.
If the number of substitutes is greater, the good becomes more elastic.
Necessary or not?
Medicine is necessary. Cancer medicine can sometimes cost more than \$1,000, but people won’t stop taking life-saving medicine.
If a good is necessary, it is inelastic.
Percentage of Income
If the price of gum increases, who cares? You probably won’t even notice. That’s such a tiny expense. If the price of shirts increases, then you’ll notice. A \$70 t-shirt vs. a formerly \$50 t-shirt could dissuade you from buying.
If the percentage of income is greater, the good becomes more elastic.
Length of Time for Adjustment
The week after the gasoline price increased, your gas tank is low. You still fill it normally. Two months later, you have carpools set up, bus routes researched, and you don’t use as much gasoline as before.
Additional time makes a good more elastic.
Graphically
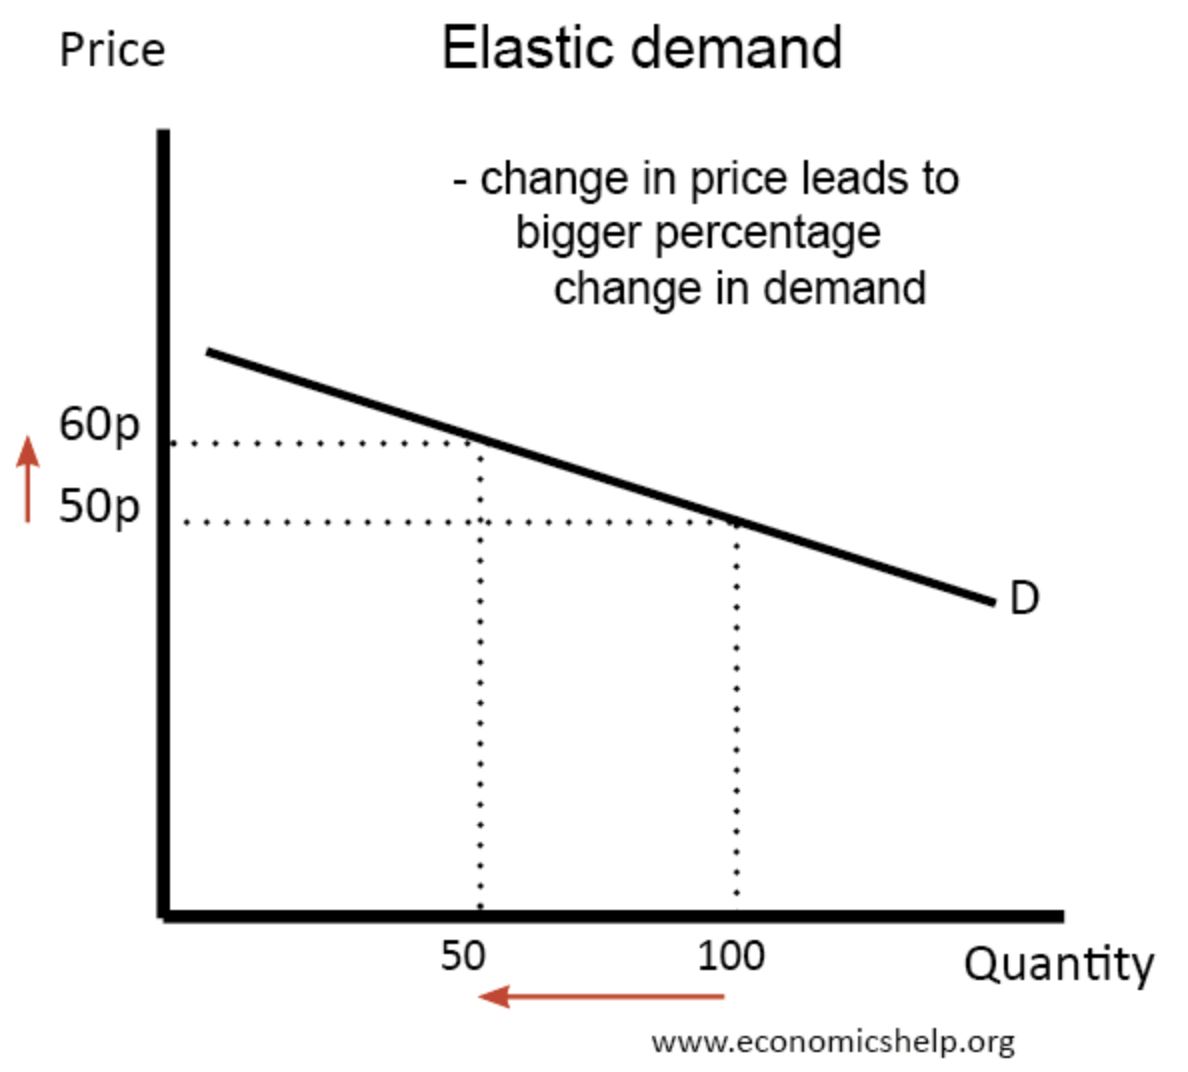
Graphically, what does the demand curve of an elastic vs. inelastic good look like?
The inelastic demand curve is very steep. A large change in price corresponds to a small change in quantity demanded.
The elastic demand curve is very shallow. A small change in price corresponds with a large change in quantity demanded.

